Fermi Captures Dynamic Gamma-ray Sky
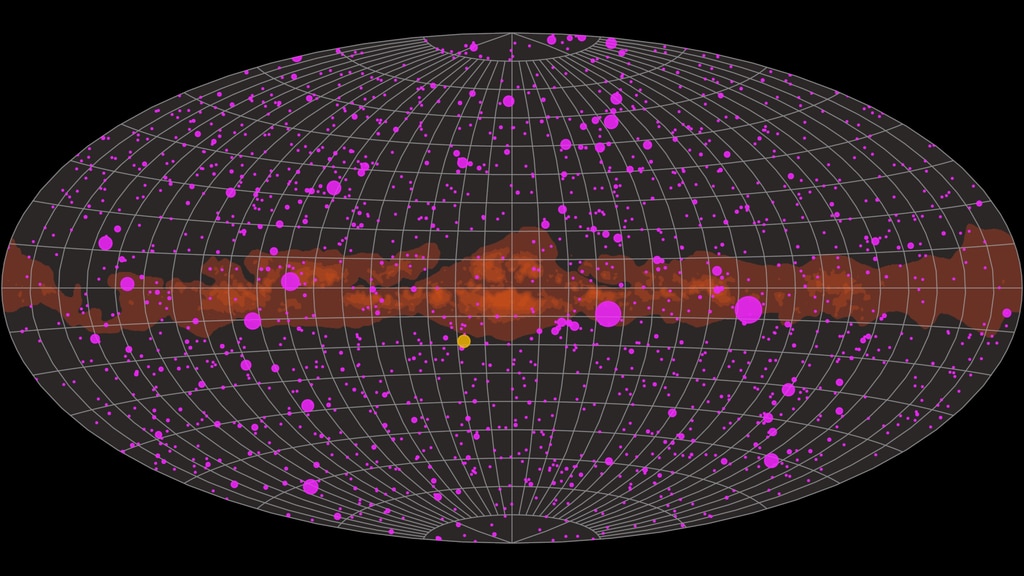
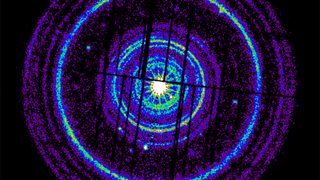
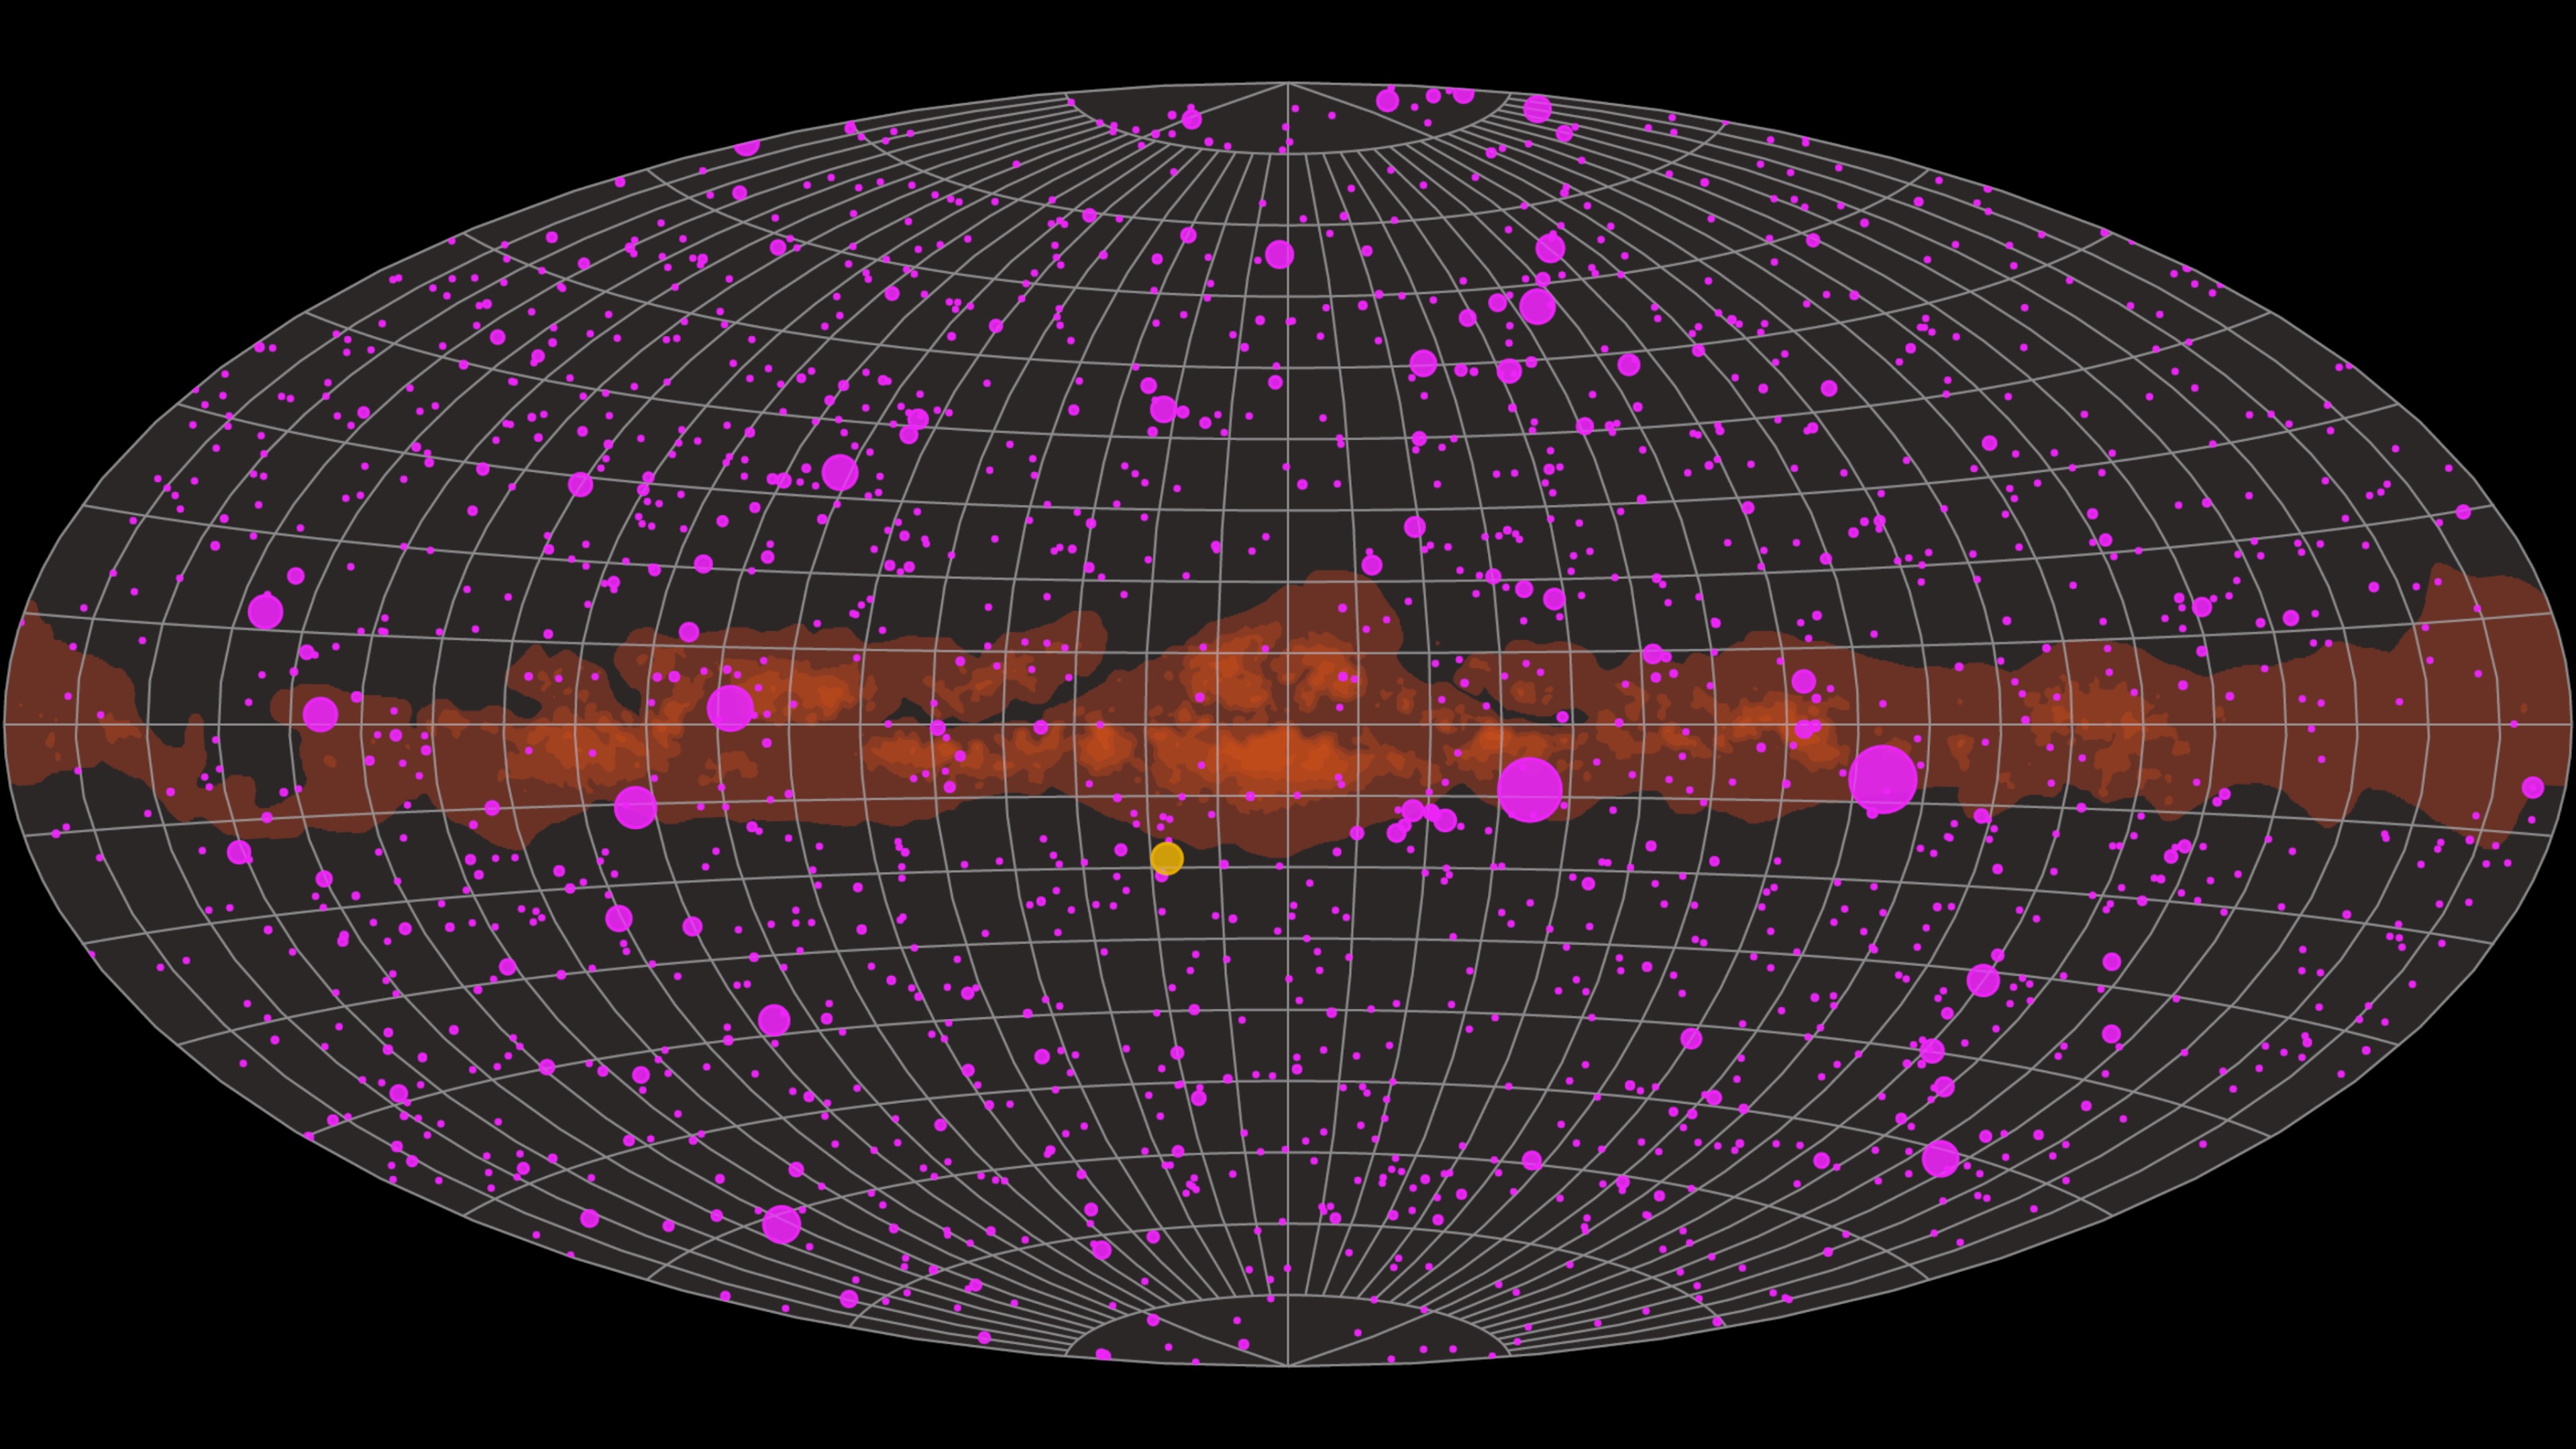
This animation shows the gamma-ray sky’s frenzied activity during a year of observations from February 2022 to February 2023. The pulsing circles represent just a subset of more than 1,500 light curves – records of how sources change in brightness over time – collected by the LAT over nearly 15 years in space.
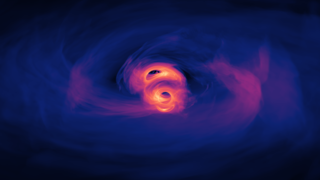
Over 90% of the sources in the dataset are blazars, central regions of galaxies hosting active supermassive black holes that produce powerful particle jets pointed almost directly at Earth. Ground-based observatories, like the National Science Foundation’s IceCube Neutrino Observatory in Antarctica, can sometimes detect high-energy particles produced in these jets. Blazars are important sources for multimessenger astronomy, where scientists use combinations of light, particles, and space-time ripples to study the cosmos.
In the animation, each frame represents three days of observations. Each object's magenta circle grows as it brightens and shrinks as it dims. Some objects fluctuate throughout the entire year. The reddish orange band running across the middle of the sky is the central plane of our Milky Way galaxy, a consistent gamma-ray producer. Lighter colors there indicate a brighter glow. The yellow circle shows the Sun’s apparent annual trajectory across the sky.
Processing the full catalog required about three months, or more than 400 computer years of processing time distributed over 1,000 nodes on a computer cluster located at the SLAC National Accelerator Laboratory in Menlo Park, California.
The LAT, Fermi’s primary instrument, scans the entire sky every three hours. It detects gamma rays with energies ranging from 20 million to over 300 billion electron volts. For comparison, the energy of visible light mostly falls between 2 to 3 electron volts.
Credits
Scott Wiessinger (KBR Wyle Services, LLC): Producer
NASA's Goddard Space Flight Center. However, individual items should be credited as indicated above.
https://svs.gsfc.nasa.gov/14309
Mission:
Fermi Gamma-ray Space Telescope
Data Used: Note: While we identify the data sets used in these visualizations, we do not store any further details nor the data sets themselves on our site.
This item is part of this series:
Astrophysics Visualizations
Keywords:
SVS >> Galaxy
SVS >> Astrophysics
SVS >> Universe
SVS >> Space
SVS >> Fermi
SVS >> Blazar
NASA Science >> Universe
SVS >> Gamma Ray


