Earth
ID: 5174
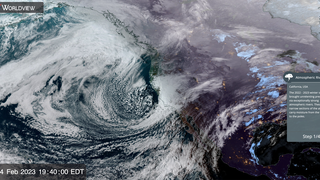
Typhoon Bolaven began as a tropical depression over the West Pacific Ocean on Oct. 7, 2023. On Oct. 10, Bolaven became a Typhoon and passed over the Mariana Islands as it tracked to the northwest. Bolaven then rapidly intensified over 12 hours from a Category 1 to a Category 5 storm on the Saffir-Simpson scale, starting around 12 UTC on Oct. 10. Several factors contributed to the rapid intensification, including modest shear in the atmosphere and warm sea-surface temperatures.
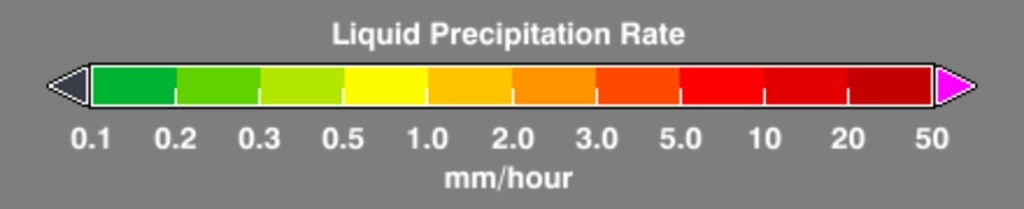
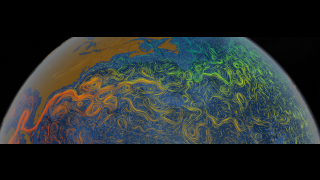
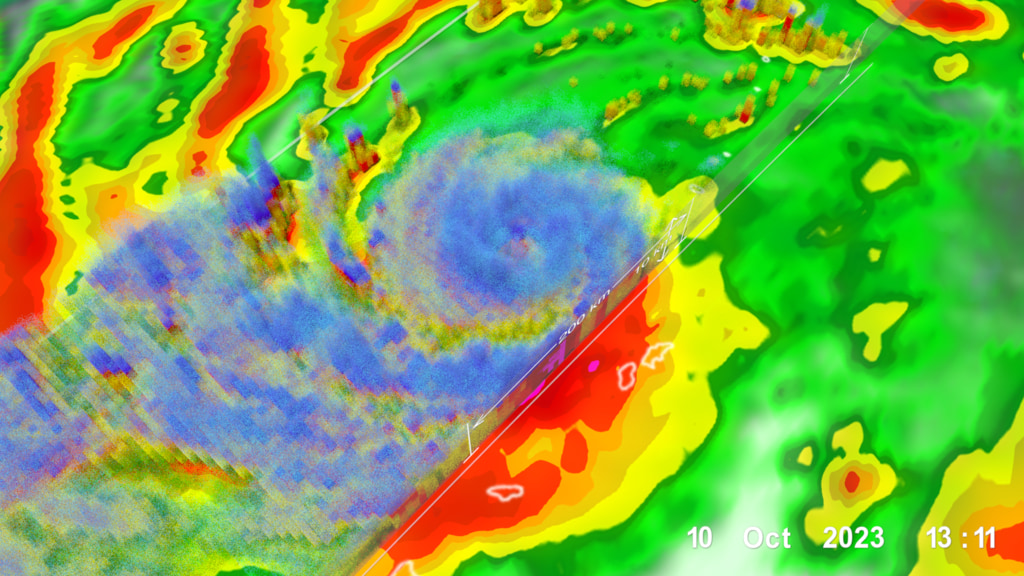
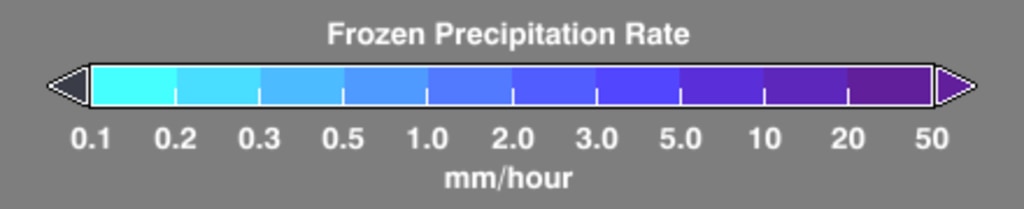
This animation shows precipitation within Typhoon Bolaven around the time that rapid intensification began. The global view at the beginning of the animation shows precipitation rate estimates from NASA’s IMERG multi-satellite data product starting at 1241 UTC on Oct. 9. The 3D view shown during the rest of the animation visualizes data collected by the Dual-Frequency Precipitation Radar (DPR) onboard the NASA/JAXA Global Precipitation Measurement (GPM) Core Observatory satellite when it flew over the storm at 1311 UTC on Oct. 10. In the visualization, yellow, red, and pink colors indicate rainfall within the storm at lower altitudes, while blue and purple colors indicate frozen precipitation located higher in the atmosphere. The DPR also detected a 20 dBZ radar reflectivity signal above 14.5 km altitude indicating a hot tower in the eyewall of Typhoon Bolaven. Hot towers are associated with hurricane intensification.
Fortunately, Bolaven's rapid intensification began after it passed near Guam and the Northern Mariana Islands. As of Oct. 12, weather models predict that Bolaven will remain over the Pacific Ocean while curving to the northeast.
GPM Views Typhoon Bolaven
This animation shows precipitation within Typhoon Bolaven around the time that rapid intensification began. The global view at the beginning of the animation shows precipitation rate estimates from NASA’s IMERG multi-satellite data product starting at 1241 UTC on Oct. 9. The 3D view shown during the rest of the animation visualizes data collected by the Dual-Frequency Precipitation Radar (DPR) onboard the NASA/JAXA Global Precipitation Measurement (GPM) Core Observatory satellite when it flew over the storm at 1311 UTC on Oct. 10. In the visualization, yellow, red, and pink colors indicate rainfall within the storm at lower altitudes, while blue and purple colors indicate frozen precipitation located higher in the atmosphere. The DPR also detected a 20 dBZ radar reflectivity signal above 14.5 km altitude indicating a hot tower in the eyewall of Typhoon Bolaven. Hot towers are associated with hurricane intensification.
Fortunately, Bolaven's rapid intensification began after it passed near Guam and the Northern Mariana Islands. As of Oct. 12, weather models predict that Bolaven will remain over the Pacific Ocean while curving to the northeast.
Visualization Credits
Alex Kekesi (Global Science and Technology, Inc.): Lead Data Visualizer
Greg Shirah (NASA/GSFC): Data Visualizer
George Huffman (NASA/GSFC): Lead Scientist
Scott Braun (NASA/GSFC): Scientist
Jacob Reed (Telophase): Scientist
Owen Kelley (George Mason University): Lead Writer
Laurence Schuler (ADNET Systems, Inc.): Lead Technical Support
Ian Jones (ADNET Systems, Inc.): Technical Support
Please give credit for this item to:
NASA's Scientific Visualization Studio. Data provided by the joint NASA/JAXA GPM mission.
NASA's Scientific Visualization Studio. Data provided by the joint NASA/JAXA GPM mission.
Short URL to share this page:
https://svs.gsfc.nasa.gov/5174
Mission:
Global Precipitation Measurement (GPM)
Data Used:
Note: While we identify the data sets used in these visualizations, we do not store any further details nor the data sets themselves on our site.
This item is part of this series:
GPM Animations
Keywords:
DLESE >> Atmospheric science
DLESE >> Hydrology
DLESE >> Natural hazards
SVS >> Tropical Storm
GCMD >> Earth Science >> Atmosphere >> Atmospheric Phenomena >> Typhoons
GCMD >> Earth Science >> Atmosphere >> Precipitation >> Rain
GCMD >> Location >> Pacific Ocean
SVS >> Hyperwall
NASA Science >> Earth
GCMD keywords can be found on the Internet with the following citation: Olsen, L.M., G. Major, K. Shein, J. Scialdone, S. Ritz, T. Stevens, M. Morahan, A. Aleman, R. Vogel, S. Leicester, H. Weir, M. Meaux, S. Grebas, C.Solomon, M. Holland, T. Northcutt, R. A. Restrepo, R. Bilodeau, 2013. NASA/Global Change Master Directory (GCMD) Earth Science Keywords. Version 8.0.0.0.0
https://svs.gsfc.nasa.gov/5174
Mission:
Global Precipitation Measurement (GPM)
Data Used:
CPC (Climate Prediction Center) Cloud Composite
Data Compilation - Climate Prediction Center (CPC) - 10/9/2023 12:41Z - 10/10/2023 13:11Z
Global cloud cover from multiple satellites
GPM/GMI/Surface Precipitation also referred to as: Rain Rates
10/10/2023 13:06 - 13:11Z
Credit:
Data provided by the joint NASA/JAXA GPM mission.
Data provided by the joint NASA/JAXA GPM mission.
GPM/DPR/Ku also referred to as: Volumetric Precipitation data
Observed Data - JAXA - 10/10/2023 12:41 - 13:11Z
Credit:
Data provided by the joint NASA/JAXA GPM mission.
Data provided by the joint NASA/JAXA GPM mission.
also referred to as: IMERG
Data Compilation - NASA/GSFC - 10/9/2023 12:41Z - 10/10/2023 13:11ZThis item is part of this series:
GPM Animations
Keywords:
DLESE >> Atmospheric science
DLESE >> Hydrology
DLESE >> Natural hazards
SVS >> Tropical Storm
GCMD >> Earth Science >> Atmosphere >> Atmospheric Phenomena >> Typhoons
GCMD >> Earth Science >> Atmosphere >> Precipitation >> Rain
GCMD >> Location >> Pacific Ocean
SVS >> Hyperwall
NASA Science >> Earth
GCMD keywords can be found on the Internet with the following citation: Olsen, L.M., G. Major, K. Shein, J. Scialdone, S. Ritz, T. Stevens, M. Morahan, A. Aleman, R. Vogel, S. Leicester, H. Weir, M. Meaux, S. Grebas, C.Solomon, M. Holland, T. Northcutt, R. A. Restrepo, R. Bilodeau, 2013. NASA/Global Change Master Directory (GCMD) Earth Science Keywords. Version 8.0.0.0.0