Earth
ID: 4070
A newer version of this visualization can be found here.
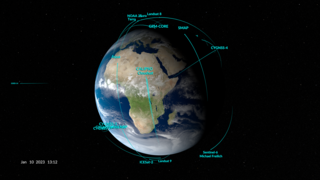
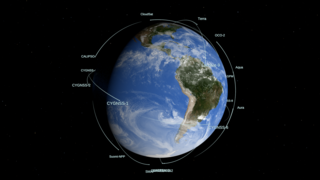
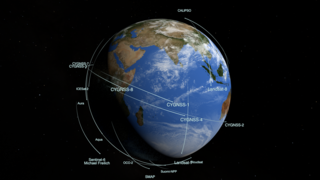
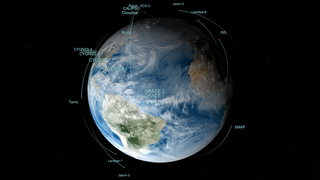
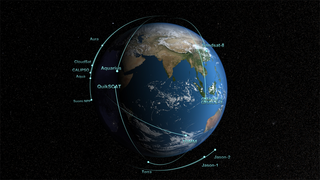
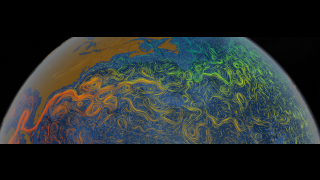
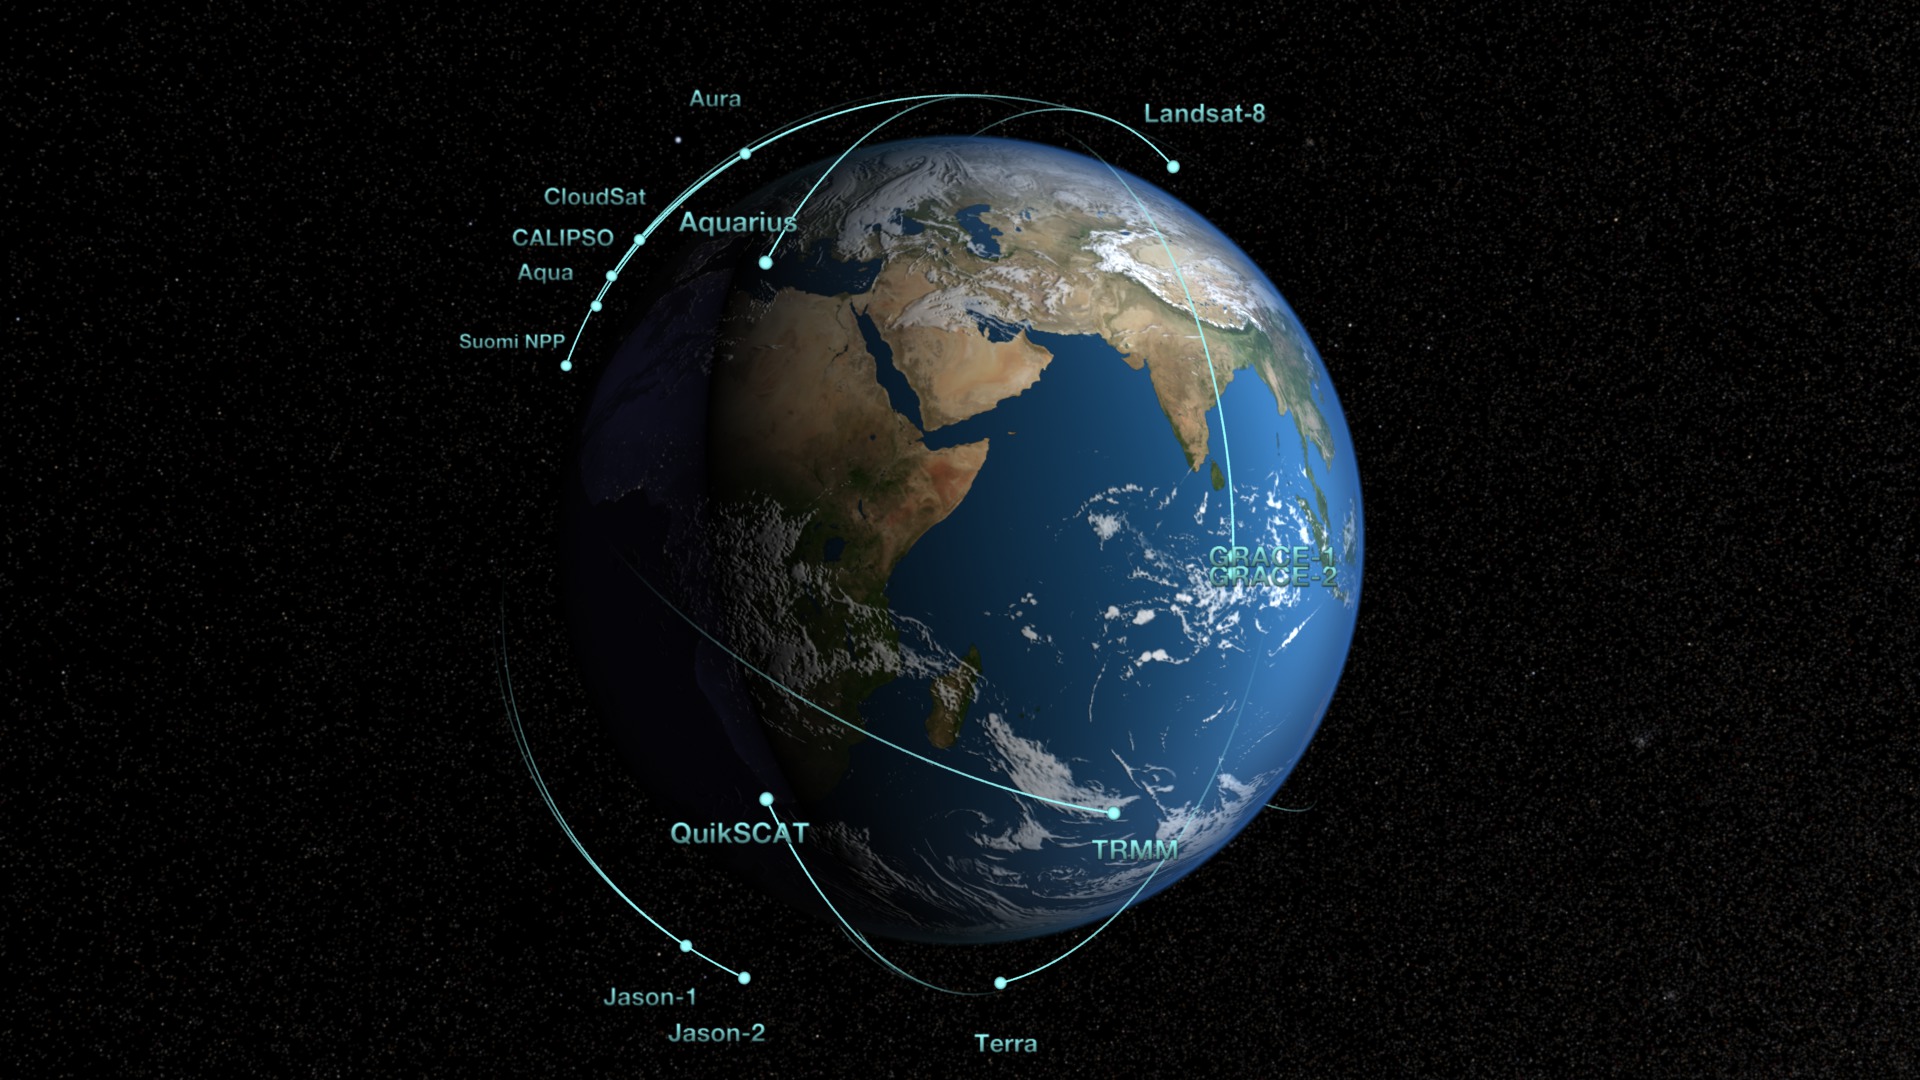
This animation shows the orbits of NASA's current (as of May 2013) fleet of Earth remote sensing observatories. The satellites include components of the A-Train (Aqua, Aura, CloudSat, CALIPSO), two satellites launched in 2011 (Aquarius, Suomi NPP), and nine others (ACRIMSAT, SORCE, GRACE, Jason 1 and 2, Landsat 7, Landsat 8, QuikSCAT, TRMM, and EO-1). These satellites measure tropical rainfall, solar irradiance, clouds, sea surface height, ocean salinity, and other aspects of the global environment. Together, they provide a picture of the Earth as a system.
NASA Earth Observing Fleet including Landsat 8
There is a newer version of this story located here: https://svs.gsfc.nasa.gov/5061
This animation shows the orbits of NASA's current (as of May 2013) fleet of Earth remote sensing observatories. The satellites include components of the A-Train (Aqua, Aura, CloudSat, CALIPSO), two satellites launched in 2011 (Aquarius, Suomi NPP), and nine others (ACRIMSAT, SORCE, GRACE, Jason 1 and 2, Landsat 7, Landsat 8, QuikSCAT, TRMM, and EO-1). These satellites measure tropical rainfall, solar irradiance, clouds, sea surface height, ocean salinity, and other aspects of the global environment. Together, they provide a picture of the Earth as a system.
This is an update of visualization #3725. It was created for display on the NASA Center for Climate Simulation (NCCS) hyperwall, a 5 x 3 array of high-definition displays with a total pixel resolution of 6840 x 2304. The orbits are based on orbital elements with epochs in April of 2013. The visualization spans twenty-nine hours, from 04:10 UT on April 14, 2013 to 09:24 UT on Aril 15, 2013.
Newer Versions
Related
Visualization Credits
Greg Shirah (NASA/GSFC): Lead Animator
Ernie Wright (USRA): Animator
Alex Kekesi (Global Science and Technology, Inc.): Animator
Matthew R. Radcliff (USRA): Producer
Ernie Wright (USRA): Animator
Alex Kekesi (Global Science and Technology, Inc.): Animator
Matthew R. Radcliff (USRA): Producer
Please give credit for this item to:
NASA/Goddard Space Flight Center Scientific Visualization Studio
NASA/Goddard Space Flight Center Scientific Visualization Studio
Short URL to share this page:
https://svs.gsfc.nasa.gov/4070
Missions:
Aquarius
Aura
CALIPSO
Cloudsat
Landsat
LDCM: Landsat Data Continuity Mission
NPP
Terra
Data Used:
Note: While we identify the data sets used in these visualizations, we do not store any further details nor the data sets themselves on our site.
This item is part of these series:
Hyperwall
LDCM
Keywords:
DLESE >> Atmospheric science
SVS >> HDTV
SVS >> Landsat
SVS >> Simulation
SVS >> Spacecraft
GCMD >> Earth Science >> Atmosphere
GCMD >> Earth Science >> Atmosphere >> Clouds
SVS >> Orbit
SVS >> Hyperwall
SVS >> Aquarius
SVS >> Calipso
SVS >> Cloudsat
SVS >> Aura
SVS >> GRACE
SVS >> NPP
SVS >> LDCM
SVS >> Earth >> Satellites >> Earth Observing Fleet
NASA Science >> Earth
GCMD keywords can be found on the Internet with the following citation: Olsen, L.M., G. Major, K. Shein, J. Scialdone, S. Ritz, T. Stevens, M. Morahan, A. Aleman, R. Vogel, S. Leicester, H. Weir, M. Meaux, S. Grebas, C.Solomon, M. Holland, T. Northcutt, R. A. Restrepo, R. Bilodeau, 2013. NASA/Global Change Master Directory (GCMD) Earth Science Keywords. Version 8.0.0.0.0
https://svs.gsfc.nasa.gov/4070
Missions:
Aquarius
Aura
CALIPSO
Cloudsat
Landsat
LDCM: Landsat Data Continuity Mission
NPP
Terra
Data Used:
CelesTrak Spacecraft Orbit Ephemeris
EphemerisTerra and Aqua/MODIS/Blue Marble: Next Generation also referred to as: BMNG
Credit:
The Blue Marble data is courtesy of Reto Stockli (NASA/GSFC).
The Blue Marble data is courtesy of Reto Stockli (NASA/GSFC).
GEOS-5 Atmospheric Model on the Cubed-Sphere also referred to as: GEOS-5 Cubed-Sphere
Model - NASA GMAO
The model is the GEOS-5 atmospheric model on the cubed-sphere, run at 14-km global resolution for 30-days. GEOS-5 is described here http://gmao.gsfc.nasa.gov/systems/geos5/ and the cubed-sphere work is described here http://sivo.gsfc.nasa.gov/cubedsphere_overview.html.
This item is part of these series:
Hyperwall
LDCM
Keywords:
DLESE >> Atmospheric science
SVS >> HDTV
SVS >> Landsat
SVS >> Simulation
SVS >> Spacecraft
GCMD >> Earth Science >> Atmosphere
GCMD >> Earth Science >> Atmosphere >> Clouds
SVS >> Orbit
SVS >> Hyperwall
SVS >> Aquarius
SVS >> Calipso
SVS >> Cloudsat
SVS >> Aura
SVS >> GRACE
SVS >> NPP
SVS >> LDCM
SVS >> Earth >> Satellites >> Earth Observing Fleet
NASA Science >> Earth
GCMD keywords can be found on the Internet with the following citation: Olsen, L.M., G. Major, K. Shein, J. Scialdone, S. Ritz, T. Stevens, M. Morahan, A. Aleman, R. Vogel, S. Leicester, H. Weir, M. Meaux, S. Grebas, C.Solomon, M. Holland, T. Northcutt, R. A. Restrepo, R. Bilodeau, 2013. NASA/Global Change Master Directory (GCMD) Earth Science Keywords. Version 8.0.0.0.0