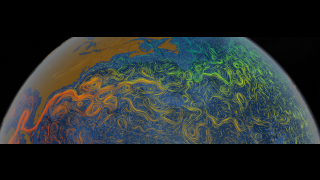
Earth
ID: 5007
Data Sources:
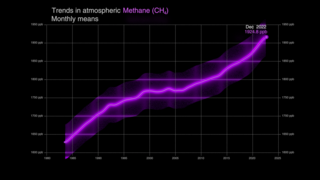
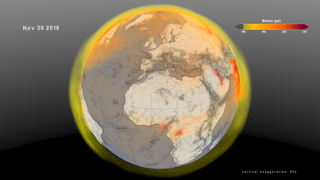
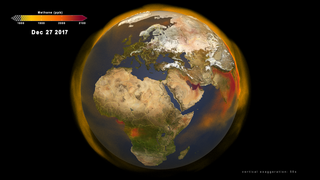
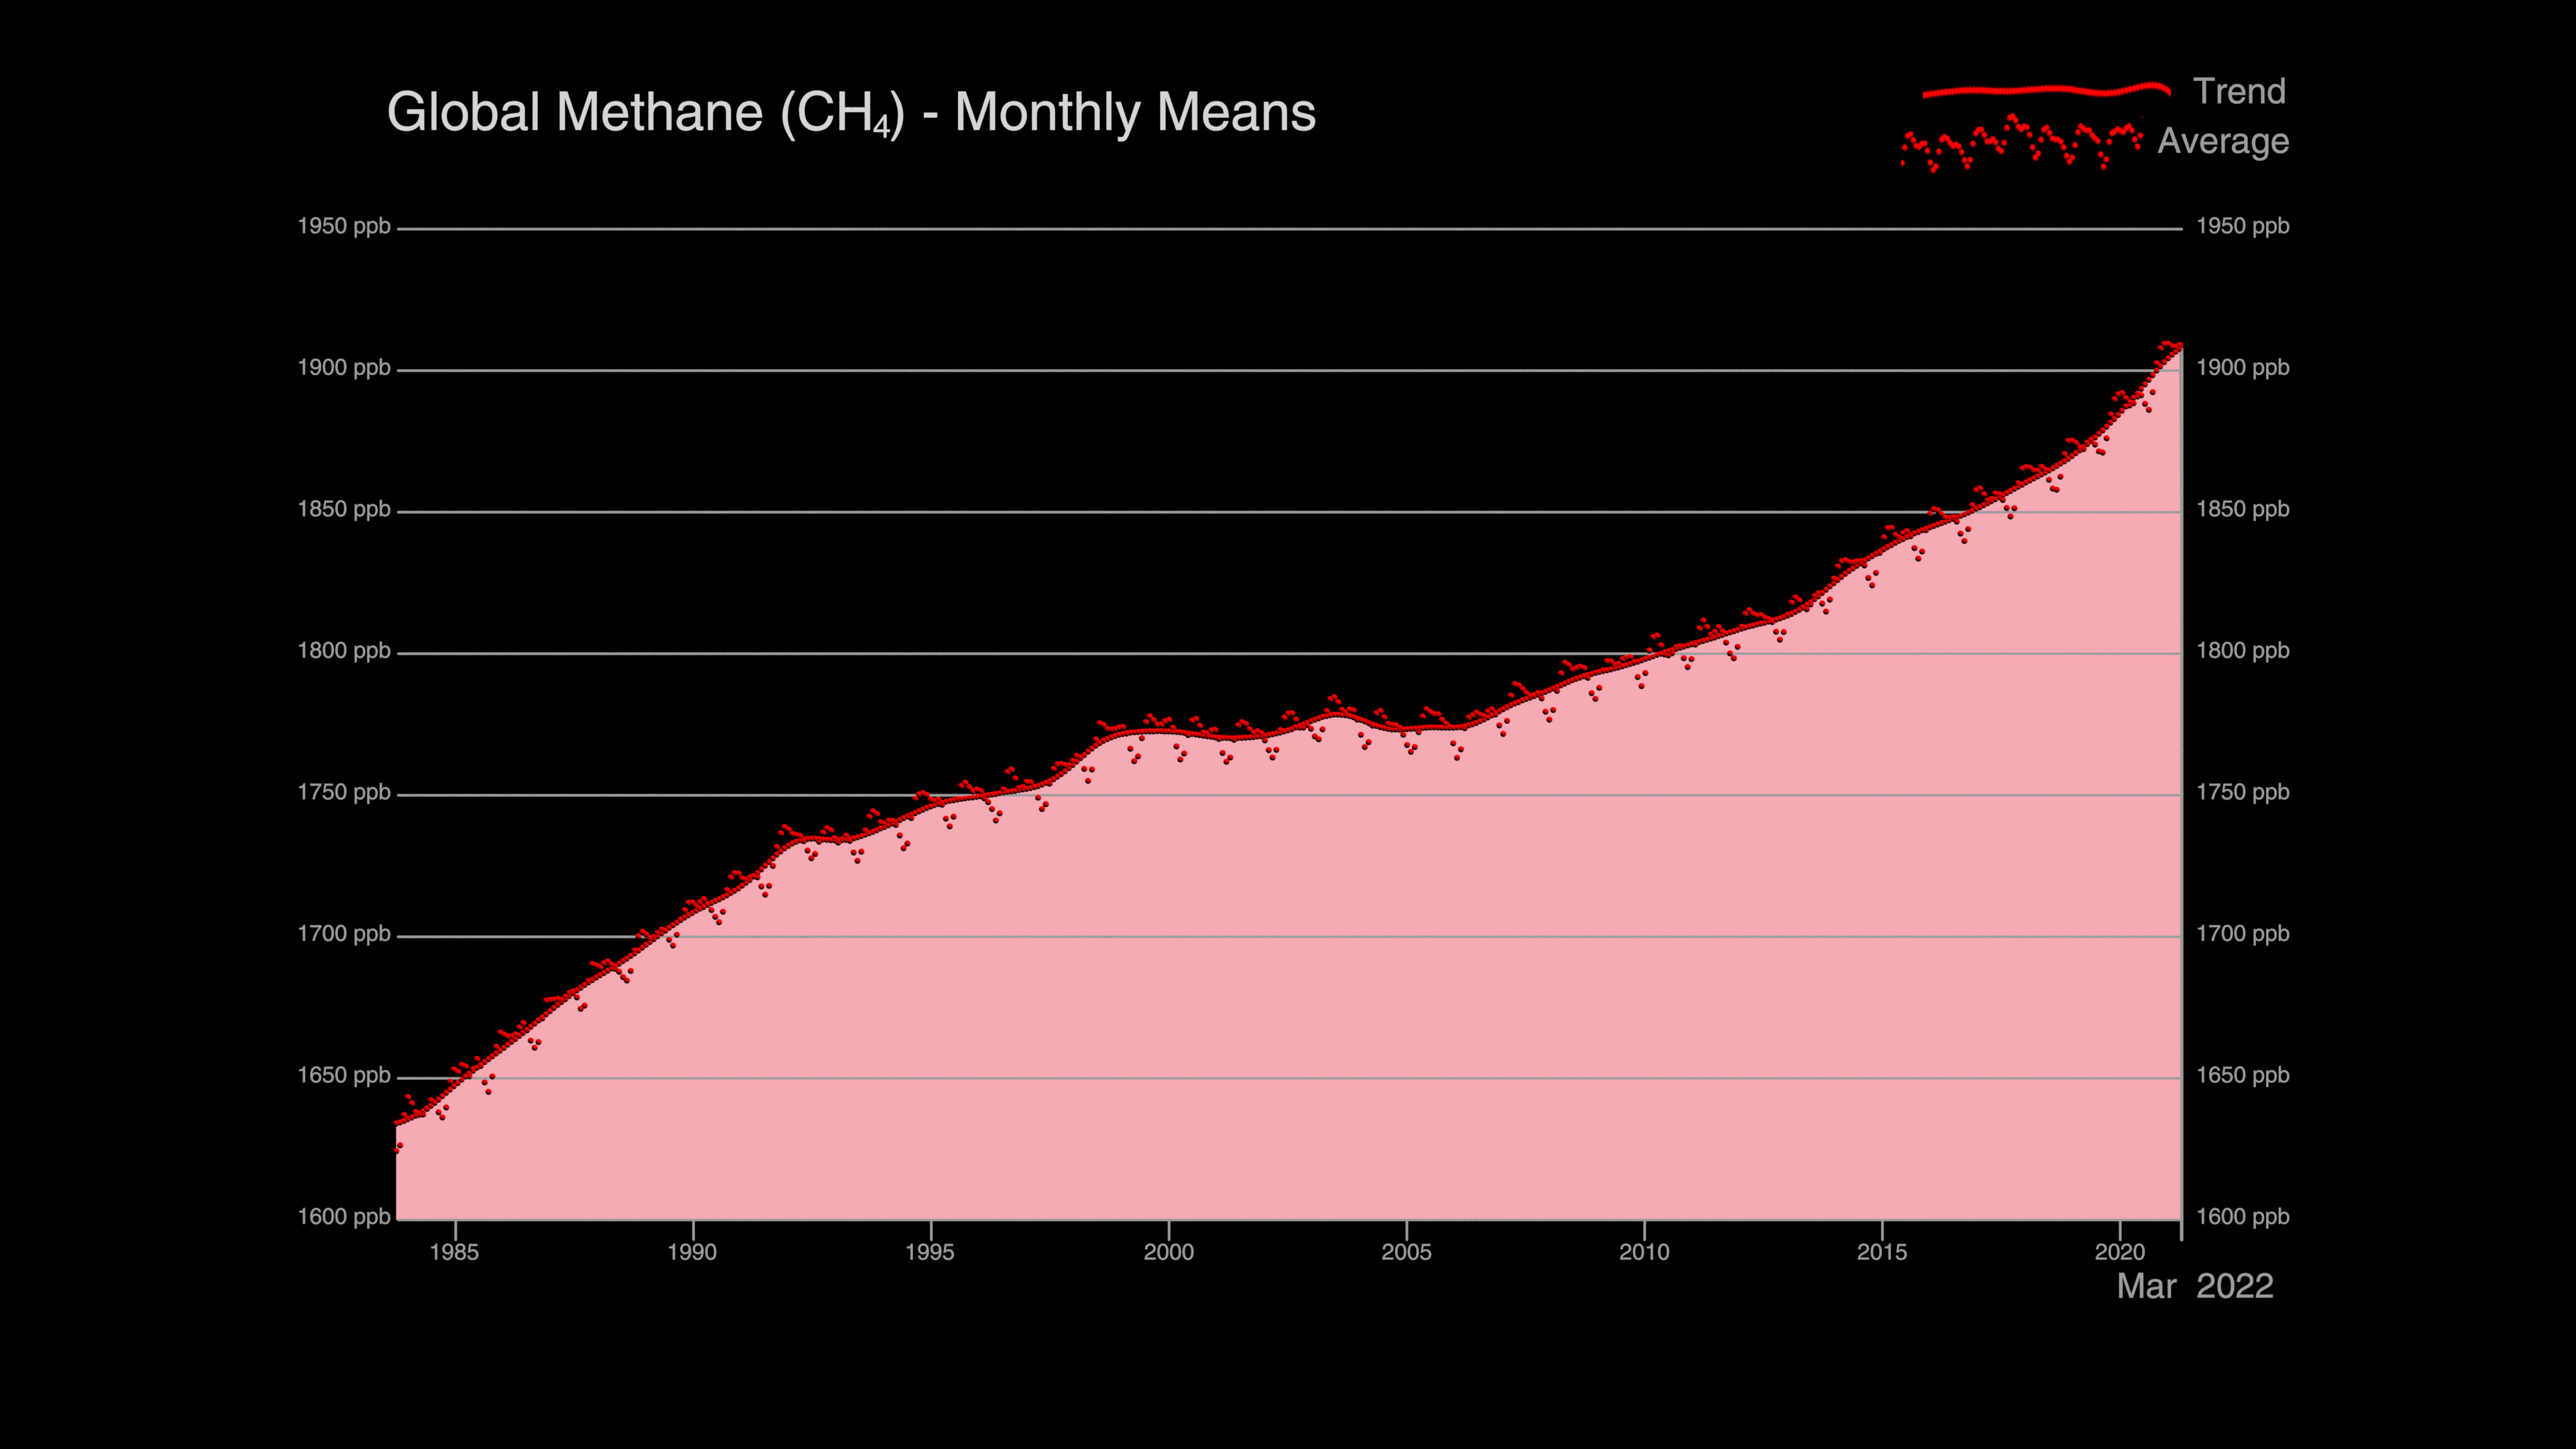
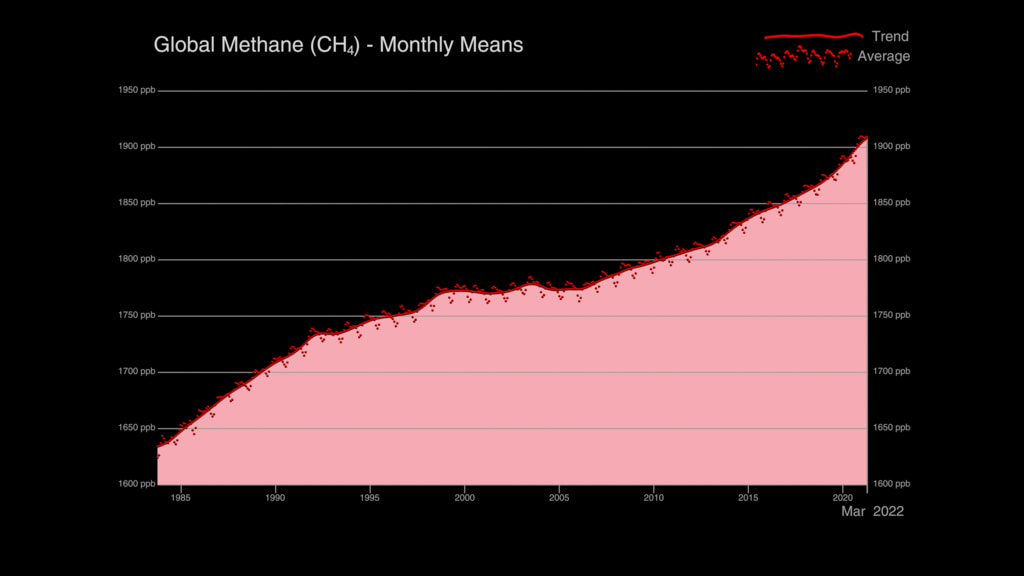
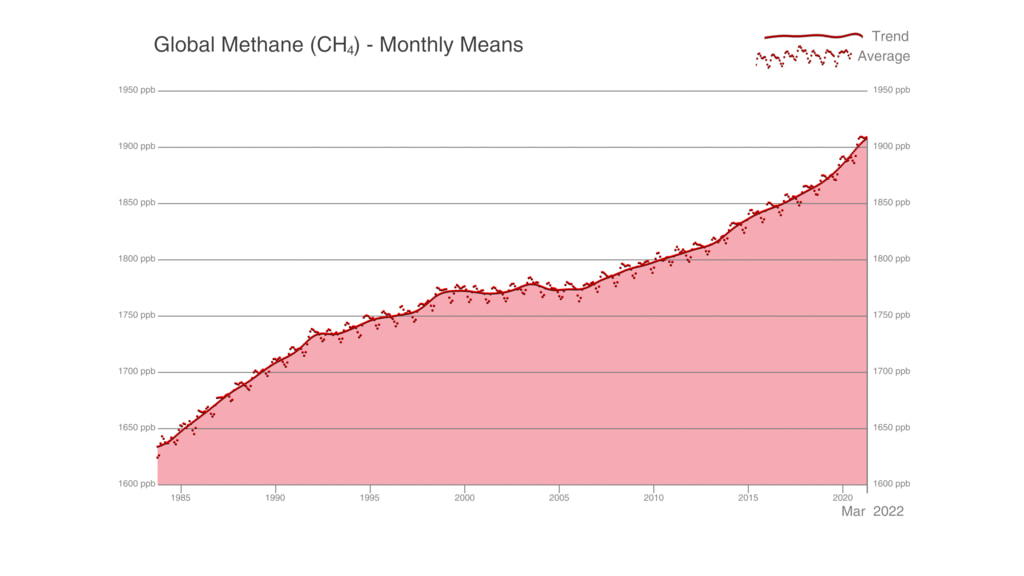
Trends in Global Atmospheric Methane (CH₄)
Data Sources:
- Trends in Athmospheric Methane by NOAA. The visualizations featured on this page utilize the complete record from the Globally averaged marine surface monthly mean data for the period July 1983-March 2022 (accessed: August 4, 2022). Within the data record the globally averaged monthly mean values are centered on the middle of each month and are represented in the visualization as the jagged/wavy Average line. The continuous line shows the long-term Trend, where the average seasonal cycle has been removed.
Citation: Ed Dlugokencky, NOAA/GML (https://gml.noaa.gov/ccgg/trends_ch4/)
Citation: Dlugokencky, E. J., L. P. Steele, P. M. Lang, and K. A. Masarie (1994), The growth rate and distribution of atmospheric methane, J. Geophys. Res., 99, 17,021– 17,043, doi:10.1029/94JD01245.
Related
Visualization Credits
Helen-Nicole Kostis (USRA): Lead Visualizer
Lesley Ott (NASA/GSFC): Lead Scientist
Laurence Schuler (ADNET Systems, Inc.): Technical Support
Ian Jones (ADNET Systems, Inc.): Technical Support
Eric Sokolowsky (Global Science and Technology, Inc.): Technical Support
Lesley Ott (NASA/GSFC): Lead Scientist
Laurence Schuler (ADNET Systems, Inc.): Technical Support
Ian Jones (ADNET Systems, Inc.): Technical Support
Eric Sokolowsky (Global Science and Technology, Inc.): Technical Support
Please give credit for this item to:
NASA's Scientific Visualization Studio
NASA's Scientific Visualization Studio
Science Paper:
Dlugokencky, E. J., L. P. Steele, P. M. Lang and K. A. Masarie, (1994), The growth rate and distribution of atmospheric methane, Journal of Geophysical Research, 99, D8, 17, doi:10.1029/94JD01245
Short URL to share this page:
https://svs.gsfc.nasa.gov/5007
Data Used:
Note: While we identify the data sets used in these visualizations, we do not store any further details nor the data sets themselves on our site.
Keywords:
DLESE >> Atmospheric science
SVS >> Climate
DLESE >> Environmental science
SVS >> Methane
SVS >> Hyperwall
SVS >> Climate Change
SVS >> Greenhouse Gases
SVS >> Atmospheric Science
NASA Science >> Earth
SVS >> 4K
NASA Earth Science Focus Areas >> Atmospheric Composition
NASA Earth Science Focus Areas >> Climate Variability and Change
Dlugokencky, E. J., L. P. Steele, P. M. Lang and K. A. Masarie, (1994), The growth rate and distribution of atmospheric methane, Journal of Geophysical Research, 99, D8, 17, doi:10.1029/94JD01245
Short URL to share this page:
https://svs.gsfc.nasa.gov/5007
Data Used:
NOAA Globall Averaged Marine Surface Monthly Mean Data
Credit:
NOAA/GML, Ed Dlugokencky, gml.noaa.gov/ccgg/trends_ch4/
NOAA/GML, Ed Dlugokencky, gml.noaa.gov/ccgg/trends_ch4/
Keywords:
DLESE >> Atmospheric science
SVS >> Climate
DLESE >> Environmental science
SVS >> Methane
SVS >> Hyperwall
SVS >> Climate Change
SVS >> Greenhouse Gases
SVS >> Atmospheric Science
NASA Science >> Earth
SVS >> 4K
NASA Earth Science Focus Areas >> Atmospheric Composition
NASA Earth Science Focus Areas >> Climate Variability and Change