Earth
ID: 5043
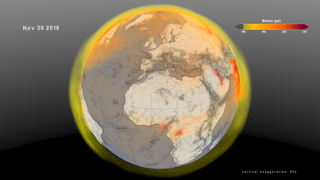
Methane is a powerful greenhouse gas that traps heat 28 times more effectively than carbon dioxide over a 100-year timescale. Concentrations of methane have increased by more than 150% since industrial activities and intensive agriculture began. After carbon dioxide, methane is responsible for about 23% of climate change in the twentieth century. Methane is produced under conditions where little to no oxygen is available. About 30% of methane emissions are produced by wetlands, including ponds, lakes and rivers. Another 20% is produced by agriculture, due to a combination of livestock, waste management and rice cultivation. Activities related to oil, gas, and coal extraction release an additional 30%. The remainder of methane emissions come from minor sources such as wildfire, biomass burning, permafrost, termites, dams, and the ocean. Scientists around the world are working to better understand the budget of methane with the ultimate goals of reducing greenhouse gas emissions and improving prediction of environmental change. For additional information, see the Global Methane Budget.
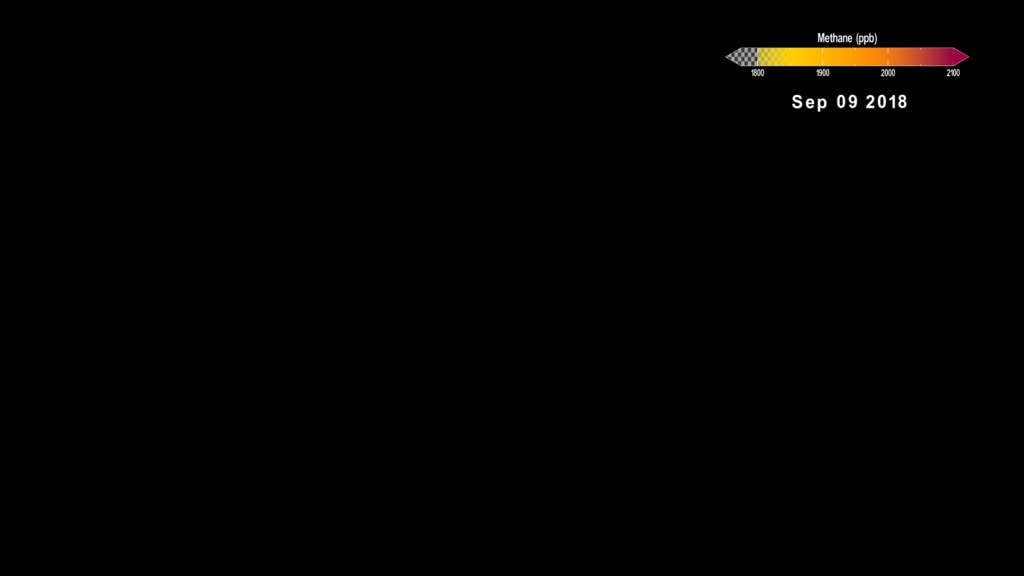
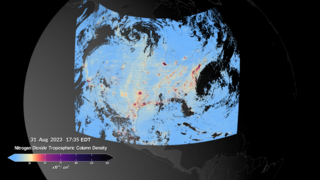
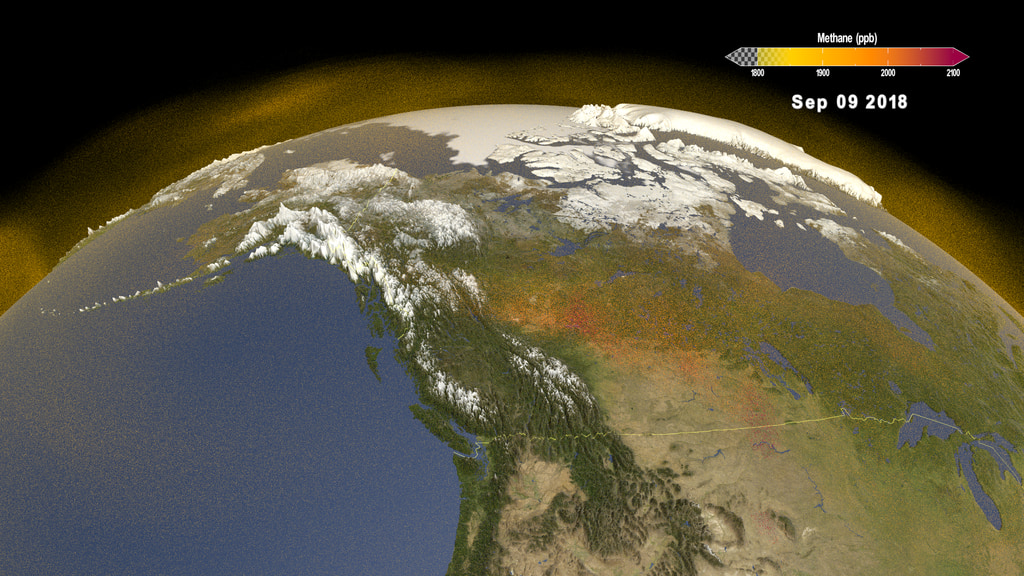
The NASA SVS visualization presented here shows the complex patterns of methane emissions produced over Canada and Alaska during the summer of 2018. The visualization was created using output from the Global Modeling and Assimilation Office, GMAO, GEOS modeling system, developed and maintained by scientists at NASA. Wetland emissions were estimated by the LPJ-wsl model, which simulates the temperature and moisture dependent methane emission processes using a variety of satellite data to determine what parts of the globe are covered by wetlands. Other methane emission sources come from inventories of human activity. The height of Earth’s atmosphere and topography have been vertically exaggerated and appear approximately 50-times higher than normal in order to show the complexity of the atmospheric flow.
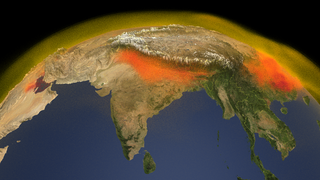
Emissions reflect a mix of agricultural and industrial activities. Emissions are transported through the atmosphere as weather systems move and mix methane around the globe. In the atmosphere, methane is eventually removed by reactive gases that convert it to carbon dioxide. Understanding the three-dimensional distribution of methane is important for NASA scientists planning observations that sample the atmosphere. Aircraft, like those launched during NASA’s Arctic Boreal Vulnerability Experiment (ABOVE) sample the atmosphere along very specific flight lines, providing additional details about the processes controlling methane emissions at high latitudes. Atmospheric models help place these measurements in context so that scientists can refine estimates of sources and sinks, understand the processes controlling them and reduce uncertainty in future projections of carbon-climate feedbacks.
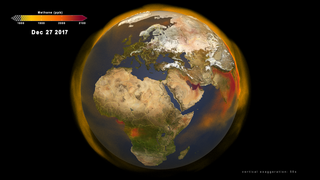
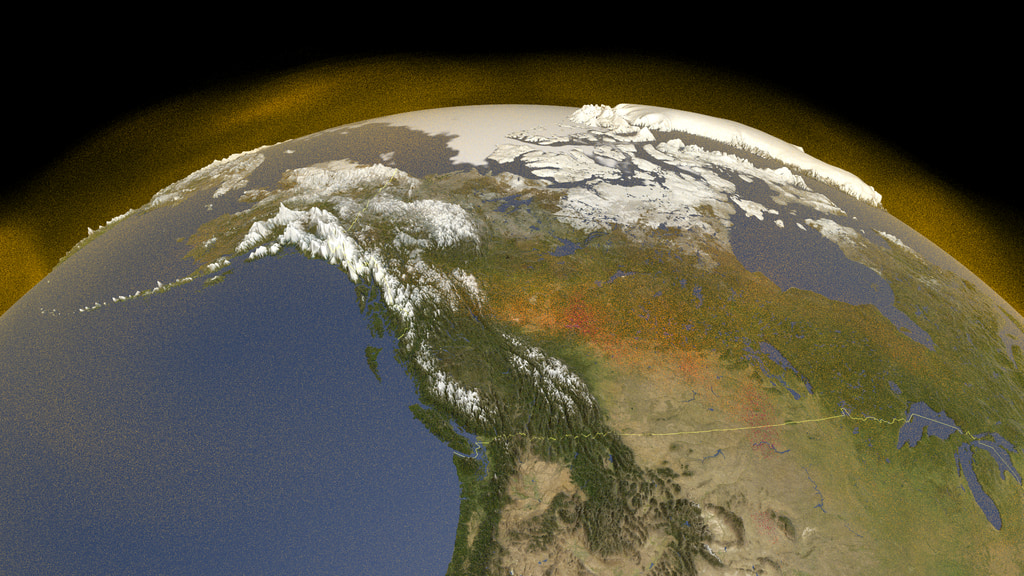
Methane Emissions over Canada and Alaska in the 2018
The NASA SVS visualization presented here shows the complex patterns of methane emissions produced over Canada and Alaska during the summer of 2018. The visualization was created using output from the Global Modeling and Assimilation Office, GMAO, GEOS modeling system, developed and maintained by scientists at NASA. Wetland emissions were estimated by the LPJ-wsl model, which simulates the temperature and moisture dependent methane emission processes using a variety of satellite data to determine what parts of the globe are covered by wetlands. Other methane emission sources come from inventories of human activity. The height of Earth’s atmosphere and topography have been vertically exaggerated and appear approximately 50-times higher than normal in order to show the complexity of the atmospheric flow.
Emissions reflect a mix of agricultural and industrial activities. Emissions are transported through the atmosphere as weather systems move and mix methane around the globe. In the atmosphere, methane is eventually removed by reactive gases that convert it to carbon dioxide. Understanding the three-dimensional distribution of methane is important for NASA scientists planning observations that sample the atmosphere. Aircraft, like those launched during NASA’s Arctic Boreal Vulnerability Experiment (ABOVE) sample the atmosphere along very specific flight lines, providing additional details about the processes controlling methane emissions at high latitudes. Atmospheric models help place these measurements in context so that scientists can refine estimates of sources and sinks, understand the processes controlling them and reduce uncertainty in future projections of carbon-climate feedbacks.
Used Elsewhere In
Alternate Versions
Related
Visualization Credits
Lead Data Visualizer:
Cindy Starr (Global Science and Technology, Inc.)
Data Visualizers:
Kel Elkins (USRA)
Greg Shirah (NASA/GSFC)
Trent L. Schindler (USRA)
Producers:
Katie Jepson (USRA)
Ellen T. Gray (ADNET Systems, Inc.)
Technical Support:
Laurence Schuler (ADNET Systems, Inc.)
Ian Jones (ADNET Systems, Inc.)
Scientists:
Lesley Ott (NASA/GSFC)
Benjamin Poulter (NASA/GSFC)
Abhishek Chatterjee (USRA)
Project Support:
Eric Sokolowsky (Global Science and Technology, Inc.)
Eytan Kaplan (Global Science and Technology, Inc.)
Please give credit for this item to:
NASA's Scientific Visualization Studio
NASA's Scientific Visualization Studio
Short URL to share this page:
https://svs.gsfc.nasa.gov/5043
Data Used:
Note: While we identify the data sets used in these visualizations, we do not store any further details nor the data sets themselves on our site.
Keywords:
DLESE >> Atmospheric science
DLESE >> Environmental science
SVS >> Methane
GCMD >> Earth Science >> Atmosphere
GCMD >> Earth Science >> Atmosphere >> Aerosols
GCMD >> Earth Science >> Atmosphere >> Air Quality
GCMD >> Earth Science >> Atmosphere >> Atmospheric Chemistry
GCMD >> Earth Science >> Atmosphere >> Air Quality >> Emissions
GCMD >> Earth Science >> Atmosphere >> Air Quality >> Smog
GCMD >> Earth Science >> Atmosphere >> Atmospheric Chemistry/Carbon and Hydrocarbon Compounds >> Methane
SVS >> Hyperwall
NASA Science >> Earth
GCMD keywords can be found on the Internet with the following citation: Olsen, L.M., G. Major, K. Shein, J. Scialdone, S. Ritz, T. Stevens, M. Morahan, A. Aleman, R. Vogel, S. Leicester, H. Weir, M. Meaux, S. Grebas, C.Solomon, M. Holland, T. Northcutt, R. A. Restrepo, R. Bilodeau, 2013. NASA/Global Change Master Directory (GCMD) Earth Science Keywords. Version 8.0.0.0.0
https://svs.gsfc.nasa.gov/5043
Data Used:
GMAO GEOS Atmospheric Methane also referred to as: GMAO GEOS Atmospheric Methane
Model - GMAO - 12/09/2017 to 12/01/2018Keywords:
DLESE >> Atmospheric science
DLESE >> Environmental science
SVS >> Methane
GCMD >> Earth Science >> Atmosphere
GCMD >> Earth Science >> Atmosphere >> Aerosols
GCMD >> Earth Science >> Atmosphere >> Air Quality
GCMD >> Earth Science >> Atmosphere >> Atmospheric Chemistry
GCMD >> Earth Science >> Atmosphere >> Air Quality >> Emissions
GCMD >> Earth Science >> Atmosphere >> Air Quality >> Smog
GCMD >> Earth Science >> Atmosphere >> Atmospheric Chemistry/Carbon and Hydrocarbon Compounds >> Methane
SVS >> Hyperwall
NASA Science >> Earth
GCMD keywords can be found on the Internet with the following citation: Olsen, L.M., G. Major, K. Shein, J. Scialdone, S. Ritz, T. Stevens, M. Morahan, A. Aleman, R. Vogel, S. Leicester, H. Weir, M. Meaux, S. Grebas, C.Solomon, M. Holland, T. Northcutt, R. A. Restrepo, R. Bilodeau, 2013. NASA/Global Change Master Directory (GCMD) Earth Science Keywords. Version 8.0.0.0.0